
Financial statement analysis tools are online software tools that enable you to analyze financial statements, calculate financial ratios, do financial comparisons, and analyze historical financial performance. Instead of downloading numbers from various annual reports and doing all of the calculations by hand, a financial statement analysis platform does all the calculations and shows you the results on one screen.
Choosing between them depends on what you want to do. A long-term investor may want 10 to 30 years of historical financial information. A research analyst may want to see filings, earnings transcripts, and consensus estimates. A beginner investor may want a free tool that offers more basic income statements, balance sheets, and cash flow statements. Read ahead to know more about financial statement analysis tools, and find the best fit for you.
What Can Financial Statement Analysis Tools Help You Analyze?
Financial statement analysis tools reduce the manual work involved in collecting, organizing, and comparing company financials. The exact functions differ between platforms.
- Revenue and earnings: Compare revenue, gross profit, operating income, net income, and per share earnings across multiple reporting periods. Compare multiple years: You get more information when you look at, for instance, three years’ worth of results, rather than just one.
- Profitability: Most financial analysis platforms provide ratios such as: Gross margin, Operating margin, Net profit margin, Return on equity, Return on assets, Return on invested capital.
These ratios help you compare profitability between companies and track changes over time. - Liquidity and financial strength: The balance sheet provides information about cash, debt, receivables, inventory, current assets, and current liabilities. Common measures include: Current ratio, Quick ratio, Debt-to-equity ratio, Net debt, Interest coverage, Working capital.
These figures help you assess whether a company has enough financial resources to meet its obligations. - Cash flow: Profit does not equal cash generation. Financial statement analysis tools help you examine operating cash flow, capital expenditure, and free cash flow. A company might report rising net income while operating cash flow remains weak for several years. This needs to be evaluated comprehensively for a more objective picture.
- Valuation: Many platforms combine financial statements with market prices and valuation ratios. Common valuation metrics include: Price-to-earnings ratio, Price-to-sales ratio, Price-to-book ratio, Enterprise value-to-EBITDA, Free cash flow yield, Dividend yield
Some platforms also include discounted cash flow models. - Historical trends: Financial statements also allow you to see trends over time – in revenue, profitability, debt, cash flow, and capital allocation. Koyfin offers up to 10 years of financial statements as part of its Plus plan. GuruFocus states that it provides 30 years of financial data. Fiscal.ai offers up to 20 years or more of financial history on its Enterprise plan.
Key Features to Look for in Financial Statement Analysis Tools
Not every financial statement analysis tool provides the same depth of data. Before subscribing, check the features you will use regularly.
- Three core statements: Look for income statements, balance sheets, and cash flow statements.
- Historical depth: Five years is enough for basic research. Longer histories help when you are studying business cycles and long-term trends.
- Annual and quarterly data: Annual figures show longer-term performance. Quarterly figures help you track recent changes.
- Standardized financials: Standardized data makes comparisons easier when companies present their accounts differently.
- As-reported data: This helps you verify standardized figures against the original company filing.
- Financial ratios: Check for profitability, liquidity, leverage, efficiency, and valuation ratios.
- Segment data: Segment revenue and operating profit are useful when a company operates across several businesses.
- Analyst estimates: Estimates help you compare historical results with market expectations.
- Filings and transcripts: Direct access to annual reports, quarterly filings, and earnings calls reduces the need to switch between platforms.
- Peer comparison: Look for side-by-side company and industry comparisons.
- Screening: A good screener lets you filter companies by revenue growth, margins, debt, valuation, market capitalization, and other criteria.
- Data export: Excel or CSV export is useful if you build your own financial models.
- Data source transparency: Check where the platform gets its financial data. Simply Wall St states that its financial data comes from S&P Global Market Intelligence.
Financial Statement Analysis Tools Comparison
| Tool | Best For | Key Analysis | Financial Statements | Pricing |
| Koyfin | Investors and analysts | Ratios, trends, valuation, screening | Income statement, balance sheet, cash flow | Free, paid plans from $39/month |
| TIKR | Fundamental investors | Financials, estimates, screening, transcripts | Income statement, balance sheet, cash flow | Free, paid plans from $24.95/month |
| Fiscal.ai | AI-assisted investment research | Financials, KPIs, DCF, estimates | Annual and quarterly financials | Free, Pro $39/month |
| Stock Rover | Fundamental stock screening | Ratios, valuation, screening | Historical fundamental financial data | Paid plans from $29/month annually |
| Yahoo Finance | Beginners and general investors | Statements, ratios, research | Income statement, balance sheet, cash flow | Free, paid plans available |
| AlphaSense | Professional research teams | Financials, estimates, filings, peer analysis | Standardized financial statements | Custom pricing |
| GuruFocus | Value investors | Financials, valuation, screening | Income statement, balance sheet, cash flow | From $549/year |
| Simply Wall St | Visual fundamental analysis | Financial health, valuation, growth | Historical financial data | Free and paid plans |
| SEC EDGAR | Primary-source research | Filing-level analysis | Company-reported statements | Free |
| ROIC AI | Financial data and API research | Ratios, statements, historical analysis | Income statement, balance sheet, cash flow | Free, paid plans from $29/month |
List of Best Financial Statement Analysis Tools
1. Koyfin
- Website: https://www.koyfin.com/
- Analysis Capabilities: Financial ratios, historical trends, valuation, screening, estimates, charting, and portfolio analysis.
- Financial Statements Supported: Income statement, balance sheet, and cash flow statement data, with up to 10 years and 40 quarters on paid individual plans.
- Best for: Investors and analysts who want financial statements alongside market and macroeconomic data.
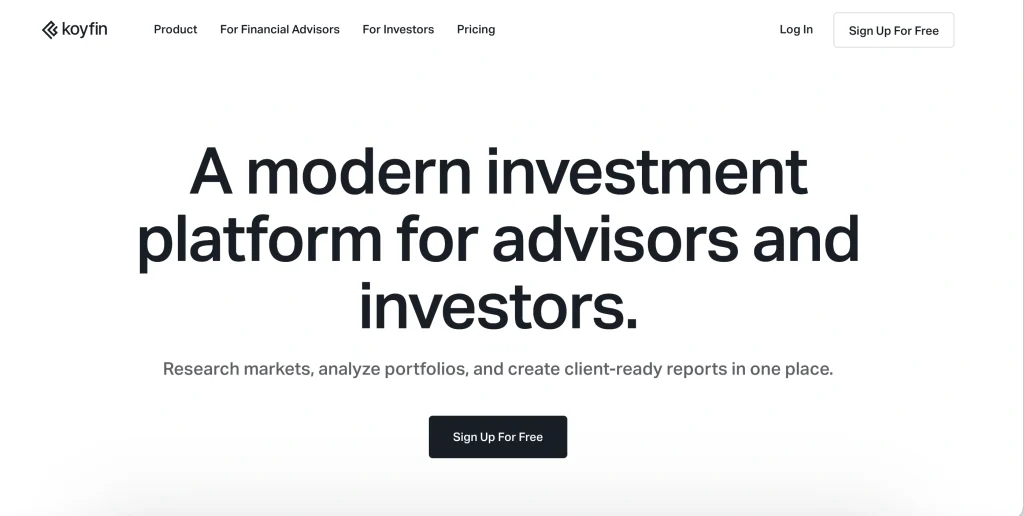
Koyfin is one of the useful financial statement analysis tools that combines company financials with market, macroeconomic, and portfolio data. Its Plus plan provides 10 years of financials and estimates. Premium adds custom formulas, custom data series, and deeper portfolio analytics.
The platform also includes screeners, dashboards, filings, and transcripts. Its free plan provides two years of financials and one year of estimates.
Key Features
- Financial statements and estimates
- Stock and ETF screening
- Custom dashboards
- Advanced charting
- Company filings and transcripts
- Portfolio analytics
Pros
- Strong combination of financial and market data
- Useful free tier
- Good historical coverage on paid plans
Cons
- Advanced features require a paid plan
- Higher-tier plans are expensive for individual users
Pricing
- Free: $0
- Plus: $39/month
- Premium: $79/month
- Advisor Core: $209/month
- Advisor Pro: $299/month
2. TIKR
- Website: https://www.tikr.com/
- Analysis Capabilities: Historical financial analysis, valuation, screening, earnings transcripts, and company research.
- Financial Statements Supported: Income statement, balance sheet, and cash flow data with deeper historical coverage on higher plans.
- Best for: Fundamental investors who want detailed company research.
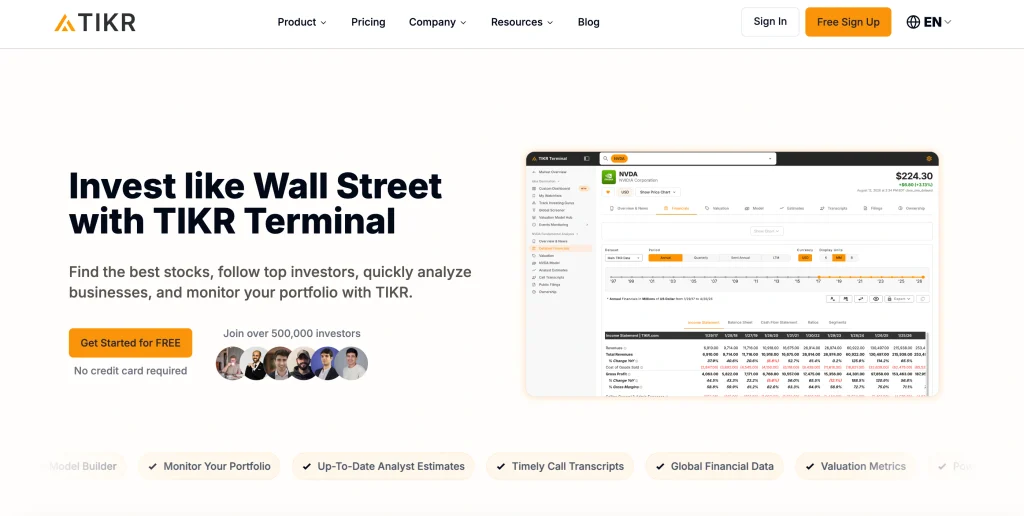
TIKR focuses on fundamental investment research. The platform provides financial data, estimates, company transcripts, and screening tools.
Its Pro plan offers 20 years of data, while higher plans provide broader platform access. The free plan provides an entry point for investors who want to test the service.
Key Features
- Historical financial statements
- Analyst estimates
- Earnings transcripts
- Company screening
- Watchlists
- Custom newsfeeds
Pros
- Strong focus on fundamental research
- Free plan available
- Long historical coverage on higher plans
Cons
- Advanced global coverage requires payment
- Higher plans are expensive for casual investors
Pricing
- Free: $0
- Plus: $24.95/month
- Pro: $54.95/month
- Ultimate: $119.95/month
3. Fiscal.ai

- Website: https://fiscal.ai/
- Analysis Capabilities: Financial statement analysis, KPI analysis, DCF modelling, estimates, screening, and AI-assisted research.
- Financial Statements Supported: Annual and quarterly income statements, balance sheets, and cash flow data.
- Best for: Investors who want financial analysis alongside AI-assisted research features.
Fiscal.ai is one of the financial statement analysis tools covering more than 100,000 global stocks, ETFs, and funds according to its pricing information. Its free plan includes 10 years of annual financials and six quarters of quarterly financials.
The Pro plan extends coverage to 15 years and 20 quarters. Enterprise provides 20 years or more and 40 quarters of financial history, along with as-reported and standardiz
Key Features
- Financial statements
- Industry KPIs
- DCF modelling
- Analyst estimates
- AI-assisted research
- Equity research
- Common-size financials
Pros
- Broad global coverage
- Strong historical financial data
- DCF and KPI analysis included
Cons
- Enterprise pricing is high for individual investors
- Some advanced functions require paid plans
Pricing
- Free: $0
- Pro: $39/month
- Enterprise: $199/month
4. Stock Rover
- Website: https://www.stockrover.com/
- Analysis Capabilities: Fundamental screening, financial ratios, valuation, portfolio analysis, and historical financial analysis.
- Financial Statements Supported: Fundamental financial data covering up to 20 years on the Ultimate plan.
- Best for: Investors who screen large numbers of stocks using fundamental criteria.
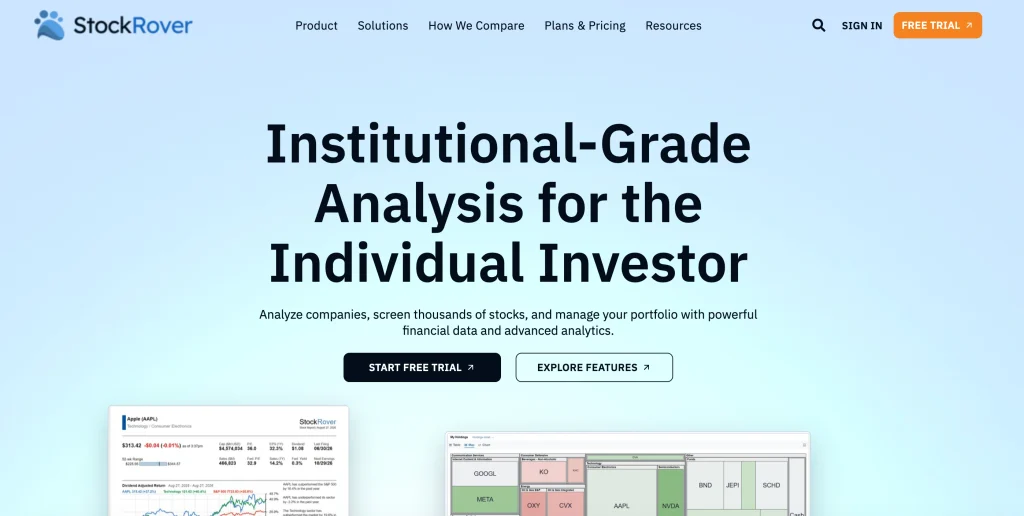
Stock Rover focuses heavily on stock screening and fundamental research. Its Premium plan covers more than 8,500 stocks, 7,000 ETFs, and 40,000 funds, with more than 400 metrics and five years of fundamentals.
Premium Plus extends fundamentals to 10 years, while Ultimate provides 20 years. The platform also includes valuation charts, custom metrics, and portfolio tools.
Key Features
- Hundreds of financial metrics
- Fundamental stock screening
- Valuation charts
- Portfolio management
- Custom metrics
- Historical financial data
Pros
- Excellent screening depth
- Large security coverage
- Strong fundamental filters
Cons
- More complex than beginner-focused platforms
- Full functionality requires a paid plan
Pricing
- Premium: $29/month when billed annually
- Premium Plus: $49/month
- Ultimate: $79/month
- Ultimate Investor: $149/month
5. Yahoo Finance
- Website: https://finance.yahoo.com/
- Analysis Capabilities: Financial statements, company research, portfolio tracking, valuation information, and historical market data.
- Financial Statements Supported: Income statements, balance sheets, and cash flow statements.
- Best for: Beginners and investors who need accessible financial information.
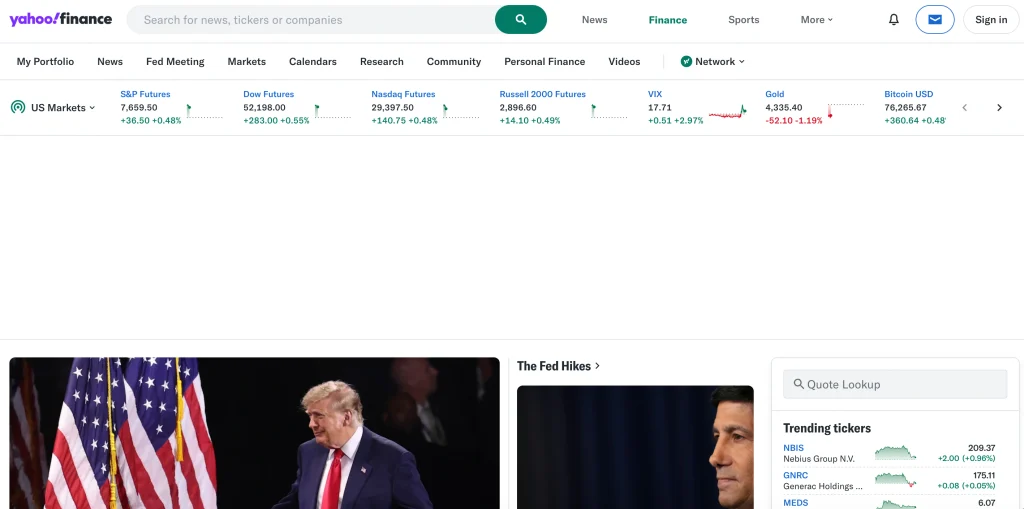
Yahoo Finance is one of the practical financial statement analysis tools for basic company research. Its free service provides market information and company financials, while paid plans add deeper historical data and research features.
Yahoo Finance Gold provides long historical coverage of income statements, balance sheets, and cash flow reports.
Key Features
- Company financial statements
- Historical market data
- Portfolio tracking
- Stock screeners
- Research reports
- Financial statement downloads on paid plans
Pros
- Familiar interface
- Useful free access
- Strong historical data on higher plans
Cons
- Advanced research functions require payment
- Less specialized than dedicated financial research platforms
Pricing
- Free: $0
- Bronze: $7.95/month
- Silver: $19.95/month
- Gold: $39.95/month
Also Read :
6. AlphaSense
- Website: https://www.alpha-sense.com/
- Analysis Capabilities: Financial statement analysis, consensus estimates, company benchmarking, etc.
- Financial Statements Supported: Income statement, balance sheet, and cash flow statement data.
- Best for: Professional investment, strategy, and research teams.
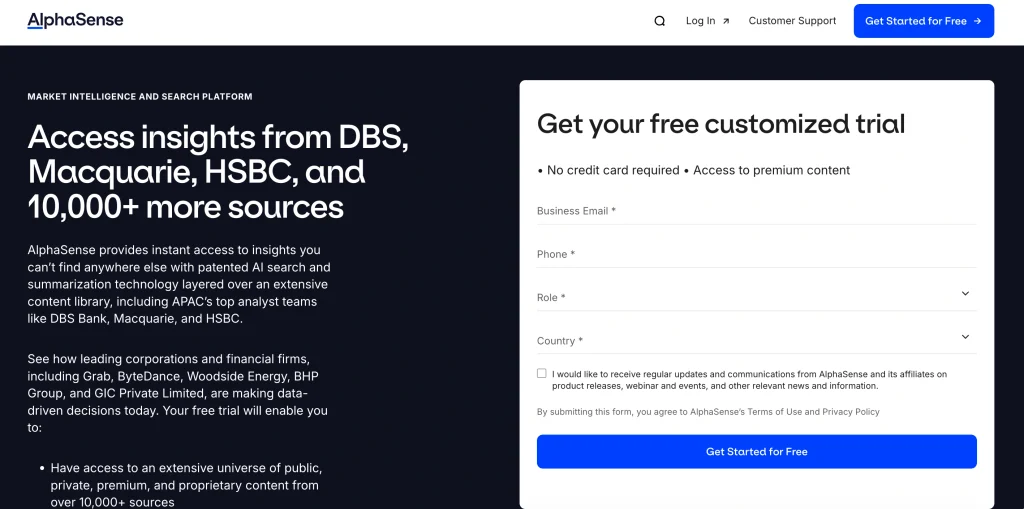
AlphaSense is designed for institutional and professional research. Alpha Sense sources its financial data from over 18,000 public companies, with actual financials and consensus estimates.
The app marries financial statements with SEC filings, earnings transcripts, broker research, and expert interviews. The app touts coverage of 90% of the S&P 100 and 80% of the largest hedge funds.
Key Features
- Standardized financial statements
- Consensus estimates
- Company benchmarking
- SEC filings
- Earnings transcripts
- Broker research
- Expert call transcripts
Pros
- Extensive professional research coverage
- Strong combination of quantitative and qualitative data
- Suitable for large research teams
Cons
- Custom pricing
- Too expensive for most individual investors
Pricing
- Custom quote from AlphaSense
7. GuruFocus
- Website: https://www.gurufocus.com/
- Analysis Capabilities: Financial statements, valuation, stock screening, historical ratios, insider activity, and investor holdings.
- Financial Statements Supported: Income statement, balance sheet, and cash flow statement data with long historical coverage.
- Best for: Value investors and investors focused on company fundamentals.
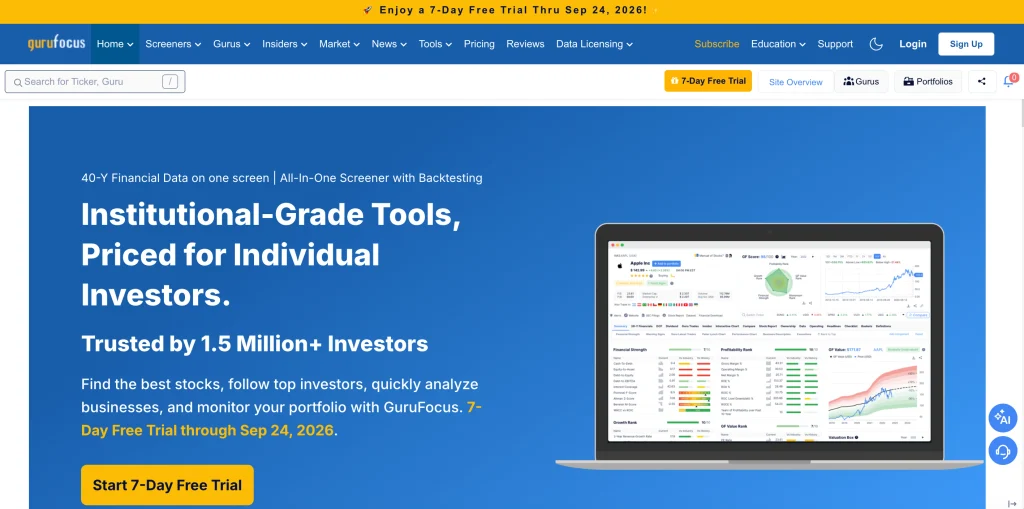
GuruFocus is one of the financial statement analysis tools that offers extensive historical financial data, valuation metrics, and screening capabilities. Its members get access to financials, filings, analyst estimates, ownership data, and earnings call transcripts.
GuruFocus states that its platform provides 30 years of financial data. Its data API covers more than 60,000 companies across nine global regions.
Key Features
- 30-year financial data
- Financial statement analysis
- DCF models
- Stock screeners
- Insider transactions
- Investor holdings
- Valuation ratios
Pros
- Deep historical coverage
- Strong value-investing tools
- Extensive screening functions
Cons
- High annual subscription cost
- Large feature set takes time to learn
Pricing
- Premium: $549/year for the U.S. market
- Premium Plus: $1,398/year
- Pro: $2,448/year
8. Simply Wall St
- Website: https://simplywall.st/
- Analysis Capabilities: Financial health, valuation, growth, dividends, portfolio analysis, and company comparisons.
- Financial Statements Supported: Historical company financial data sourced from S&P Global Market Intelligence.
- Best for: Investors who prefer visual fundamental analysis.
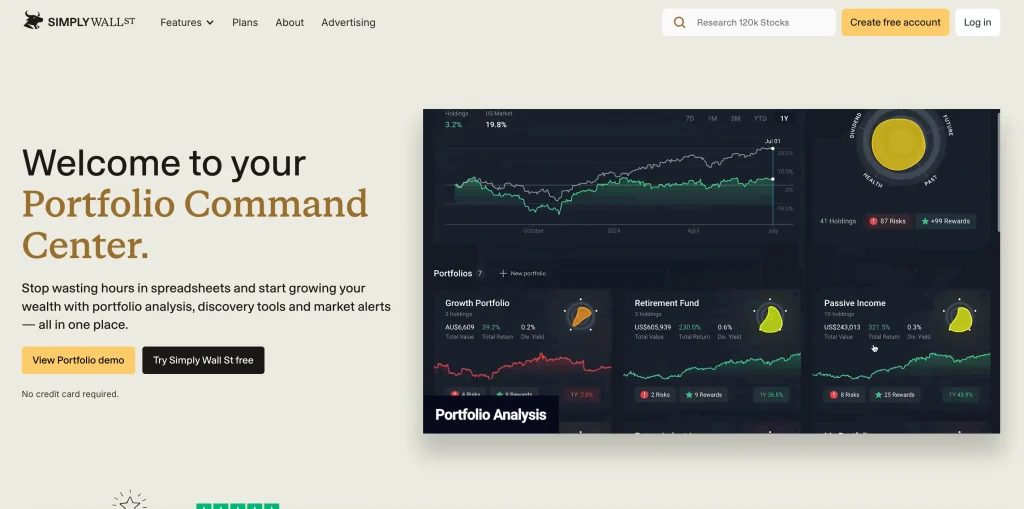
Simply Wall St presents company fundamentals through visual reports instead of dense financial tables. Its platform covers more than 120,000 stocks across more than 90 markets and reports more than 7 million users.
Free users receive five company reports per month, Premium users receive 30, while Unlimited removes the company report limit.
Key Features
- Company financial reports
- Valuation analysis
- Growth and profitability analysis
- Dividend analysis
- Portfolio tracking
- Stock screening
Pros
- Easy-to-read company reports
- Broad global market coverage
- Useful for portfolio monitoring
Cons
- Free plan has report limits
- Detailed exports require higher plans
- Less suitable for users who want raw statement-level research
Pricing
- Free plan available
- Premium paid plan
- Unlimited paid plan
9. SEC EDGAR
- Website: https://www.sec.gov/edgar/search/
- Analysis Capabilities: Filing-level financial research using primary company filings.
- Financial Statements Supported: Company-reported income statements, balance sheets, and cash flow statements within SEC filings.
- Best for: Investors and analysts who want primary-source financial information.
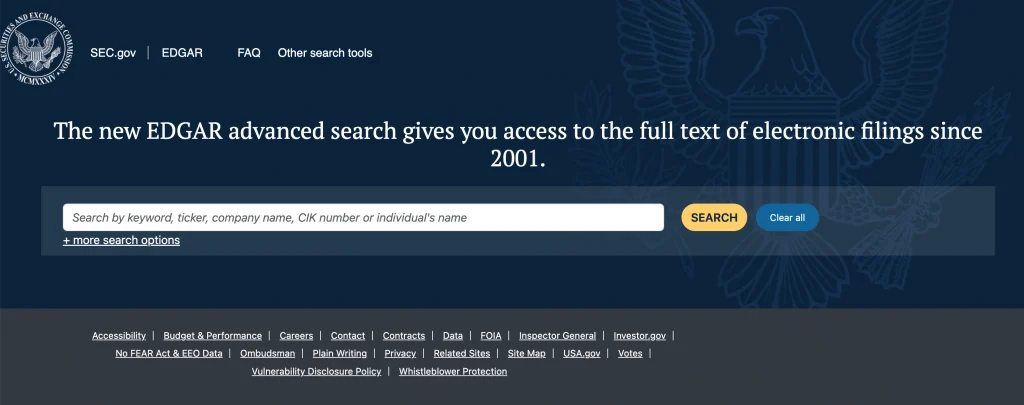
SEC EDGAR differs from commercial financial statement analysis tools. It is a primary filing database rather than an investment dashboard. You get access to company filings such as 10-K and 10-Q reports, along with XBRL financial data.
The SEC Company Facts API provides company concepts in machine-readable form, which is useful for building your own financial analysis.
Key Features
- 10-K filings
- 10-Q filings
- XBRL data
- Company Facts API
- Primary-source documents
Pros
- Free
- Primary-source information
- Excellent for verification
Cons
- Less convenient for comparing many companies
- Limited built-in investment analytics
- Focused on U.S. public companies
Pricing
- Free
10. ROIC AI
- Website: https://www.roic.ai/
- Analysis Capabilities: Financial statements, financial ratios, valuation metrics, and historical company data through web tools and APIs.
- Financial Statements Supported: Income statement, balance sheet, and cash flow statement data.
- Best for: Investors, developers, and teams working with structured financial data.
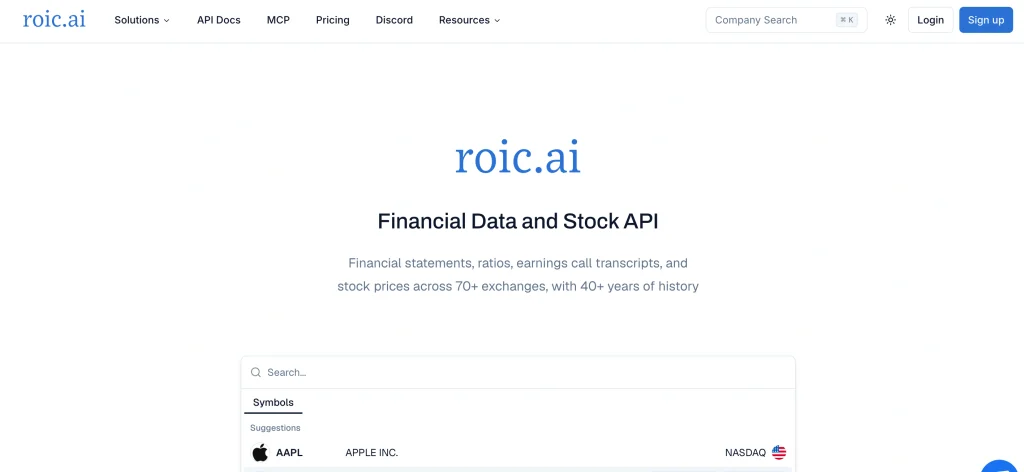
ROIC AI provides structured financial statement data for publicly traded companies. Its API covers income statements, balance sheets, and cash flow statezments, along with ratios and valuation metrics.
The free plan provides two years of annual financials, while the Individual plan provides five years and quarterly data. Professional users receive more than 40 years of history.
Key Features
- Income statement data
- Balance sheet data
- Cash flow data
- Financial ratios
- Valuation metrics
- API access
- Historical datasets
Pros
- Structured financial data
- Useful for custom analysis
- Competitive pricing for individual users
Cons
- More technical than consumer-focused platforms
- Advanced data access requires higher plans
Pricing
- Free: $0
- Individual: $29/month
- Professional: $89/month
- Enterprise: Custom pricing
Benefits of Using Financial Statement Analysis Tools
- Faster company comparison: A financial statement analysis tool puts several years of financial information into one interface. You do not need to open separate annual reports for every basic comparison.
- Better trend analysis: A single year’s revenue or profit figure provides limited information. Five, ten, or twenty years of data gives you a better view of revenue growth, margins, debt, and cash generation.
- Easier peer analysis: Standardized data makes comparison between companies faster. You might compare five banks using return on equity, net interest margin, capital ratios, and valuation multiples in one screen.
- Less manual data entry: Manual copying of financial figures into Excel creates opportunities for transcription errors. Automated datasets reduce this workload, although important figures still deserve verification against company filings.
- Quicker screening: Suppose your criteria include revenue growth above 10%, operating margin above 15%, and low net debt. A stock screener lets you filter companies using these conditions instead of checking every company individually.
- Better access to historical data: Historical depth matters when you want to understand how a company performed during different economic conditions. Fiscal.ai, GuruFocus, and Koyfin provide substantial historical coverage on higher plans.
- Easier financial modelling: Export functions and structured datasets help you move financial figures into spreadsheets, valuation models, and custom research systems.
How to Choose the Right Financial Statement Analysis Tool
Start with your actual research workflow rather than the number of features listed on a pricing page.
- If you are a beginner: Choose Yahoo Finance, SEC EDGAR, or another platform with a useful free plan. Learn how to read the three financial statements before paying for advanced data analytics tools.
- If you follow individual stocks: Koyfin, TIKR, Fiscal.ai, and Simply Wall St provide broader company research around financial statements.
- If you screen hundreds of stocks: Stock Rover is a strong option for investors who rely heavily on fundamental screening. Its platform provides hundreds of metrics and multiple screening tools.
- If you follow value investing: GuruFocus provides long historical data, valuation tools, screening, insider activity, and investor holdings.
- If you work in professional research: AlphaSense is more suitable when your work involves filings, broker research, transcripts, expert calls, and large research datasets.
- If you build financial applications: ROIC AI and the SEC’s XBRL APIs are more relevant when you need structured financial data for programmatic analysis.
Common Financial Statement Analysis Mistakes to Avoid
- Looking at revenue without checking profit margins: Revenue growth is less useful when costs rise faster than sales.
- Treating net profit as cash flow: Review operating cash flow and capital expenditure before judging cash generation.
- Ignoring debt: Two companies with similar profits might have different financial risk because of their debt levels.
- Using one ratio in isolation: A low P/E ratio does not automatically indicate an undervalued company.
- Comparing companies from different industries using the same benchmarks: A healthy margin for a retailer differs from a healthy margin for a software company.
- Ignoring share dilution: Rising net income does not tell the complete story if the number of shares also rises.
- Using standardized data without checking the source: Standardization helps comparison, but unusual accounting items still deserve a review of the original filing.
- Relying only on annual figures: Quarterly results often reveal changes in revenue, margins, working capital, and cash flow sooner.
- Ignoring working capital: Receivables and inventory growth often explain why accounting profit does not translate into operating cash flow.
- Mixing fiscal years without checking reporting dates: Companies often use different financial year-end dates, so direct annual comparisons require attention to reporting periods.
- Treating analyst estimates as facts: Estimates represent expectations. Compare them with historical results and management guidance.
- Skipping the original filing: Research platforms save time. For an important investment decision, verify unusual figures against the company’s filing.
Conclusion
The best financial statement analysis tools depend on how you research companies. Yahoo Finance and SEC EDGAR provide practical starting points at minimal prices. Fiscal.ai combines financial data with AI-assisted research and DCF tools. Stock Rover is especially useful for fundamental screening. GuruFocus suits investors who want long historical datasets and value-investing research. Simply Wall St focuses on visual fundamental analysis. AlphaSense is designed for professional research teams, while ROIC AI suits structured financial data and API workflows.
For most individual investors, a free platform is enough to learn the basics. Once your research involves repeated peer comparisons, historical screening, or detailed valuation work, a paid analysis platform becomes more useful.
FAQs
1. Which Financial Statement Analysis Tool is Best for Beginners?
Yahoo Finance and SEC EDGAR are good starting points. Yahoo Finance provides an easier interface for company research, while SEC EDGAR provides primary company filings. Simply Wall St is another option if you prefer visual company reports.
2. Which Tool Provides the Longest Financial History?
Several platforms provide extensive historical data. GuruFocus states that it provides 30 years of financial data. Fiscal.ai provides 20 years or more on its Enterprise plan, while ROIC AI states that Professional users receive more than 40 years of history.
3. Are Financial Statement Analysis Tools Free?
Some are free. SEC EDGAR is free, while Yahoo Finance provides free company research. Koyfin, TIKR, Fiscal.ai, and Simply Wall St also offer free access with different data and feature limits.
4. Which Tool is Best for Stock Screening?
Stock Rover is one of the stronger choices for investors who rely heavily on fundamental screening. It provides hundreds of metrics and multiple screening tools, with higher plans offering more extensive historical data and custom metrics.
5. Which Financial Statement Analysis Tool is Best for Professional Analysts?
AlphaSense is designed for professional research teams and combines financial statements with filings, estimates, broker research, earnings transcripts, and expert interviews. Koyfin, TIKR, and Fiscal.ai are more accessible alternatives for individual analysts and investors.
6. Should you Still Read Company Filings When Using Financial Analysis Software?
Yes. Financial analysis software saves time during research, but company filings provide the original source for reported financial information. SEC EDGAR also provides direct access to filings and machine-readable XBRL data for U.S. public companies.